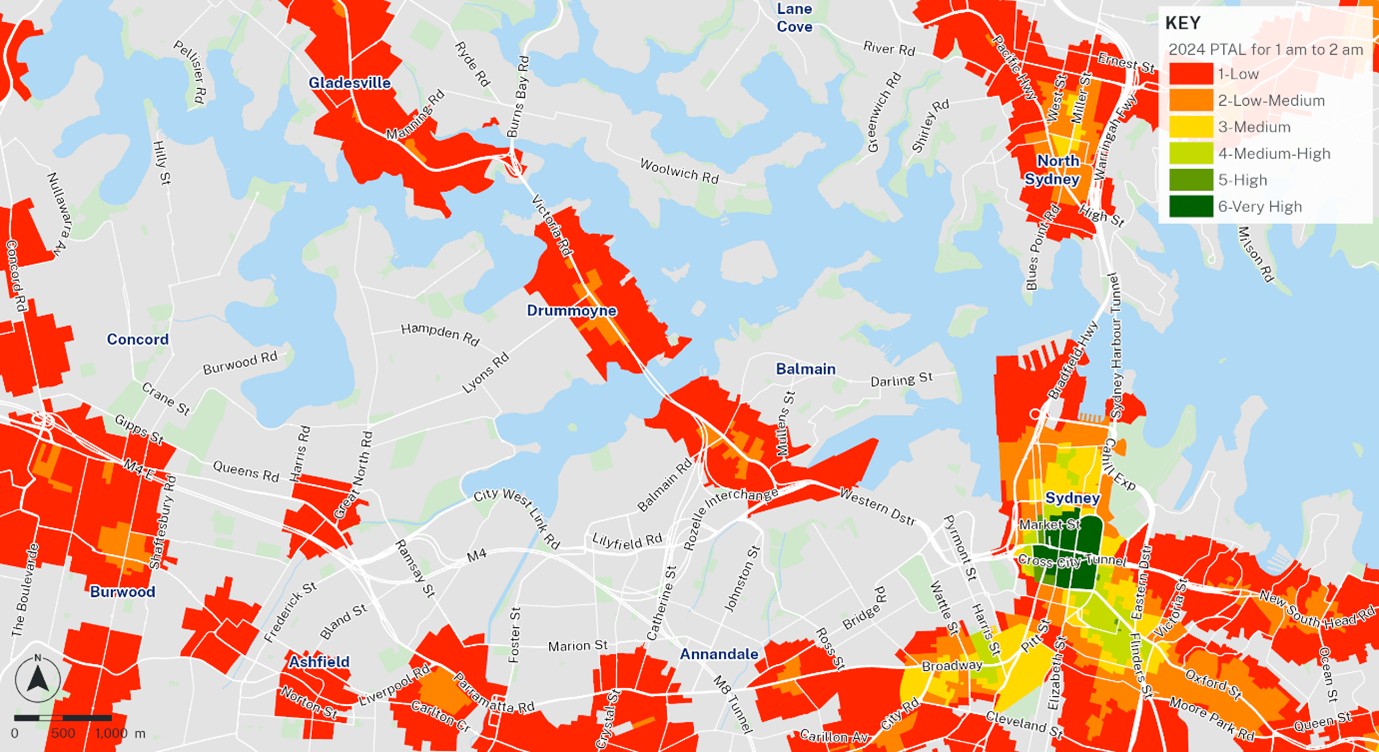
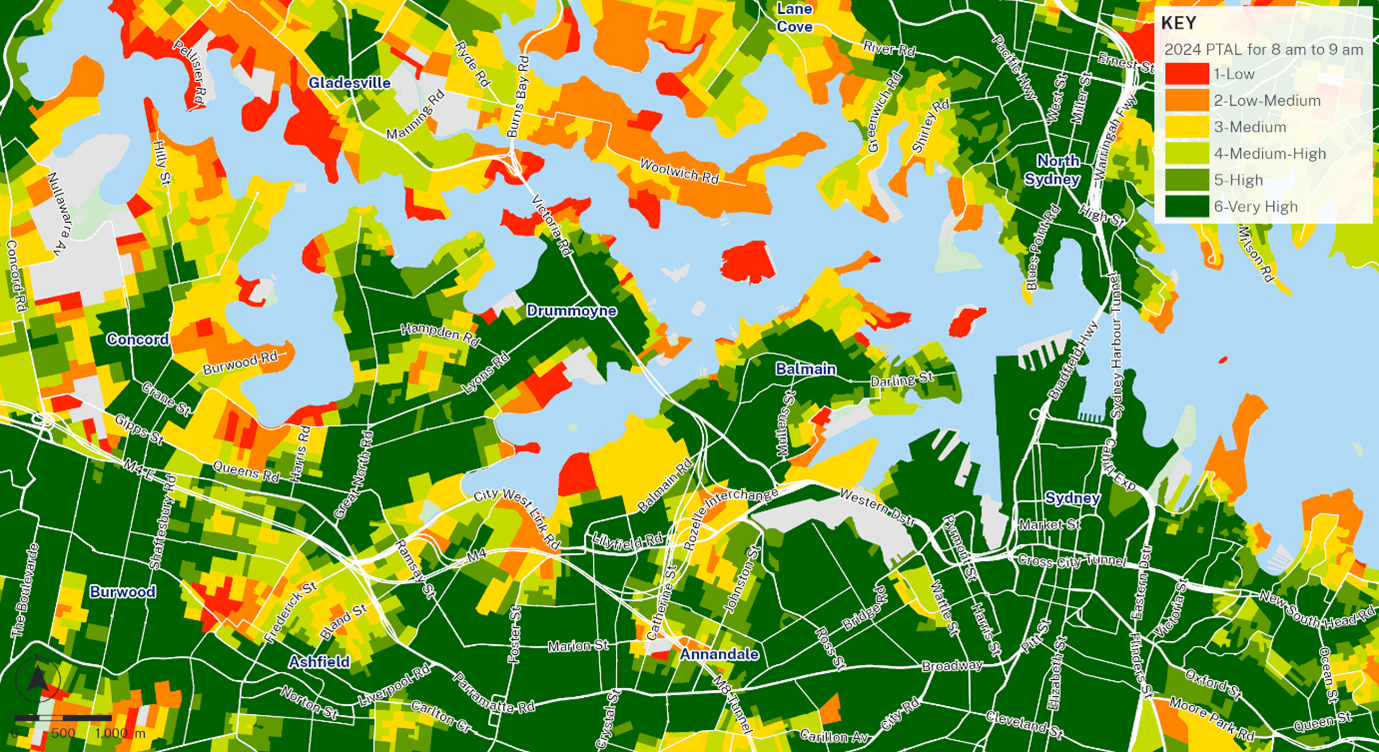
PTAL (Public Transport Accessibility Level)
Data and Resources
-
PTAL_FactSheet_May2025.pdfPDF
-
PTAL December 2024ZIP
Please remove the underscore before the .zip extension from the filename...
-
PTAL December 2023ZIP
Please remove the underscore before the .zip extension from the filename...
-
PTAL December 2022ZIP
Please remove the underscore before the .zip extension from the filename...
-
PTAL December 2021ZIP
Please remove the underscore before the .zip extension from the filename...
-
PTAL December 2020ZIP
Please remove the underscore before the .zip extension from the filename...
-
PTAL December 2019ZIP
Please remove the underscore before the .zip extension from the filename...
Additional Info
| Field | Value |
|---|---|
| Source | https://opendata.transport.nsw.gov.au/dataset/ptal-public-transport-accessibility-level |
| Maintainer | TfNSW Open Data Hub and Developer Portal |
| Last Updated | May 26, 2025, 00:26 (UTC) |
| Created | November 17, 2020, 04:47 (UTC) |

